Insights
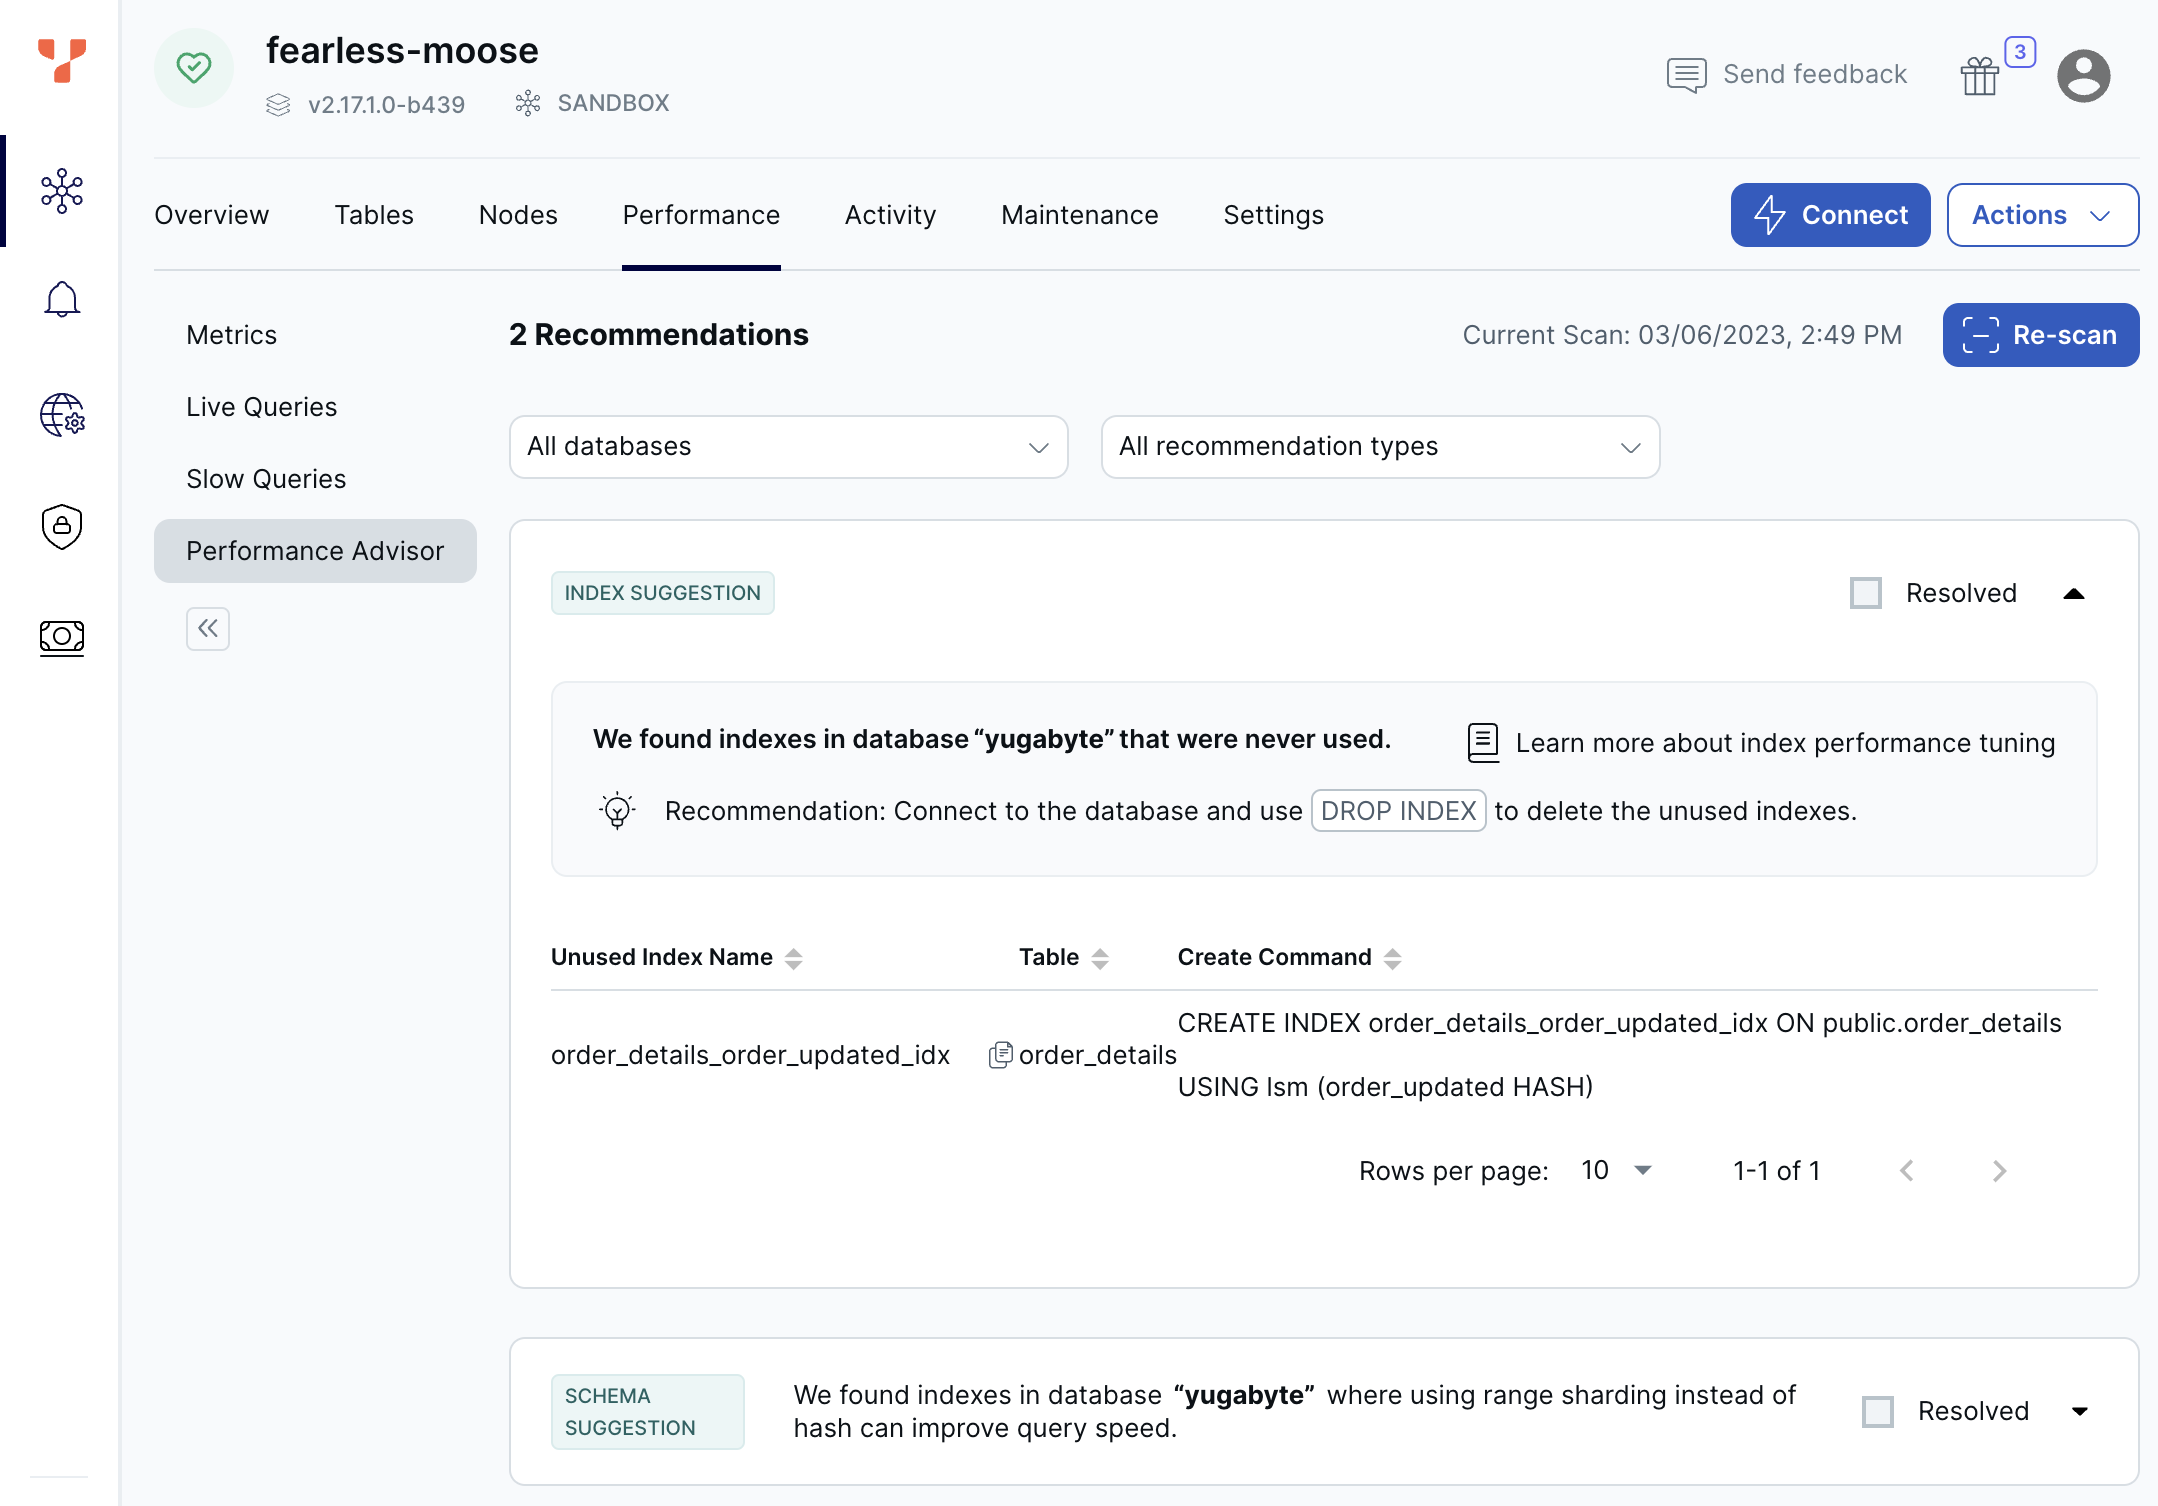
Use Insights to scan your cluster for potential optimizations.
To gather insights, click the cluster Performance tab, choose Insights, and click Scan.
For meaningful results, run your workload for at least an hour before running the scan.
To monitor clusters in real time, use the performance metrics on the cluster Overview and Performance tabs.

Recommendations
Insights provides recommendations for a number of issues.
Index suggestions
Insights suggests dropping unused indexes to improve write performance and increase storage space. Insights uses the pg_stat_all_indexes view to determine unused indexes. Any index with an idx_scan of 0 is considered unused.
Indexes take up storage space on the same disk volume as the main table. They also increase the size of backups and can add to backup and restore time.
Indexes can slow down some operations. For example:
-
When doing an INSERT or DELETE on a table, indexes need to be updated to remain consistent with the data in the main table. An index can also prevent a basic insert or delete operation from being executed as a single row transaction.
-
When doing an UPDATE on a table, if the modified column is part of the index, then the index must be updated as well.
Fix the problem
Connect to the database and use DROP INDEX to delete the unused indexes.
Schema suggestions
Advisor scans for indexes that can benefit from using range sharding instead of the default hash sharding.
Range sharding is more efficient for queries that look up a range of rows based on column values that are less than, greater than, or that lie between some user specified values. For example, with timestamp columns, most queries use the timestamp column to filter data from a range of timestamps.
The following example shows a query that filters the data using a specific time window. First, create an order_details table:
CREATE TABLE order_details (
   order_id smallint NOT NULL,
   product_id smallint NOT NULL,
   unit_price real NOT NULL,
   order_updated  timestamp NOT NULL,
   PRIMARY KEY (order_id)
);
Then create an index on order_updated using HASH sharding:
CREATE INDEX ON order_details (order_updated HASH);
The following query finds the number of orders in a specific time window:
SELECT count(*) FROM order_details
  WHERE order_updated > '2018-05-01T15:14:10.386257'
  AND order_updated < '2018-05-01T15:16:10.386257';
Fix the problem
Connect to the database and use DROP INDEX to delete the indexes, and then recreate the indexes using range sharding. For more information on sharding strategies, refer to Sharding data across nodes.
Connection skew
Advisor scans node connections to determine whether some nodes are loaded with more connections than others. Advisor flags any node handling 50% more connections than the other nodes in the past hour.
Connections should be distributed equally across all the nodes in the cluster. Unequal distribution of connections can result in hot nodes, causing higher resource use on those nodes. Excessive workload on a specific node can potentially cause stability issues.
Fix the problem
- If a load balancer is used to distribute connections among nodes of cluster, review the configuration of the load balancer. If you are using the YugabyteDB Aeon load balancer, contact Yugabyte Support.
- If you are load balancing in your application or client, review your implementation.
Query load skew
Advisor scans queries to determine whether some nodes are handling more queries than others. Advisor flags nodes that processed 50% more queries than the other nodes in the past hour, or since the advisor was last run.
Queries should be distributed equally across all nodes in the cluster. Query load skew can be due to queries not being equally distributed among connections; if particular connections are executing a greater number of queries, this can result in a hot node. Excessive workload on a specific node can potentially cause stability issues.
Fix the problem
If you see query load skew, contact Yugabyte Support.
CPU skew and CPU usage
Advisor monitors CPU use to determine whether any nodes become hot spots. Advisor flags nodes where CPU use on a node is 50% greater than the other nodes in the cluster in the past hour (skew), or CPU use for a node exceeds 80% for 10 minutes (usage).
CPU skew and high usage can be caused by a number of issues:
- A node has a higher number of connections.
- A node is receiving a higher number of queries.
- Set of rows or specific rows are accessed frequently by queries executing across different nodes in the cluster.
Any of these conditions can result in a hot spot.
Fix the problem
Review the sharding strategies for your primary and secondary indexes. Consistent hash sharding is better for scalability and preventing hot spots, while range sharding is better for range-based queries.
Limitations
- At 80%+ CPU use, Index and Schema suggestions may not provide any results.
- On clusters with more than 3 databases and multiple unused indexes, the Index suggestions may not provide optimal results.