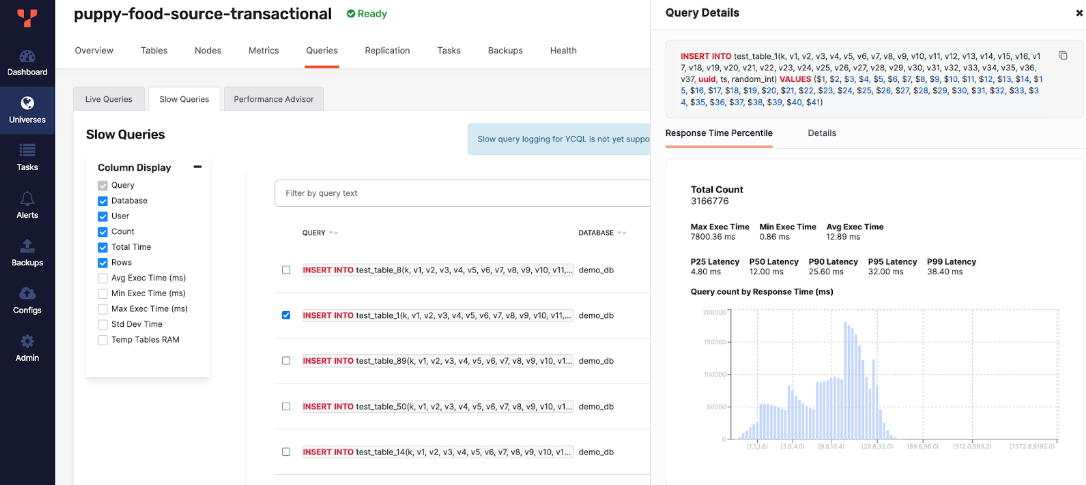
Latency histogram and P99 latencies
Percentile metrics form the core set of metrics that enable users to measure query performance against Service Level Objectives (SLO). Surfacing percentile metrics per normalized query and by Ops (Operations/second) type enables you to measure query performance against SLOs. Additionally, these metrics can help identify performance issues efficiently and quickly.
You can view P99, P95, P90, and P50 metrics for every query displayed on the Slow Queries dashboard.
You can view latency histograms for every YSQL query you run on one or multiple nodes of your universe and get an aggregated view of the metrics.
Slow queries are only available for YSQL, with percentile metrics available in YugabyteDB Anywhere v2.18.2 or later, and latency histogram support in YugabyteDB version 2.18.1 (or later), or 2.19.1 (or later).
To view the latency histogram and P99 metrics, access the Slow Queries dashboard and run YSQL queries using the following steps:
-
Navigate to Universes, select your universe, then select Queries > Slow Queries.
-
You may have to enable the Query monitoring option if it is not already.
-
Run some queries on your universe by selecting one or more queries in the Slow Queries tab.
You can see the query details listing the P25, P50, P90, P95, and P99 latency metrics as per the following illustration.

To discard latency statistics gathered so far, click the Reset stats button on the Slow Queries dashboard to run pg_stat_statements_reset() on each node.
Note
- If latency histogram is not reported by YugabyteDB Anywhere, then the histogram graph is not displayed.
- If the P99 latency statistics are not reported by YugabyteDB Anywhere (for example, because the database version doesn't support it), then
-is displayed in the Query Details.
Learn more
- Slow Query dashboard for details on how to run queries and view the results.
- Latency histogram and percentile metrics are obtained using the
yb_latency_histogramcolumn inpg_stat_statementsandyb_get_percentilefunction. Refer to Get query statistics using pg_stat_statements for details on using latency histograms in YugabyteDB.