YBA Performance Advisor EARLY ACCESS
Use Performance Advisor to scan your universe for potential optimizations.
For meaningful results, run your workload for at least an hour before running the advisor.
To monitor clusters in real time, use the universe level metrics.
Recommendations
Performance Advisor provides recommendations for a number of issues.
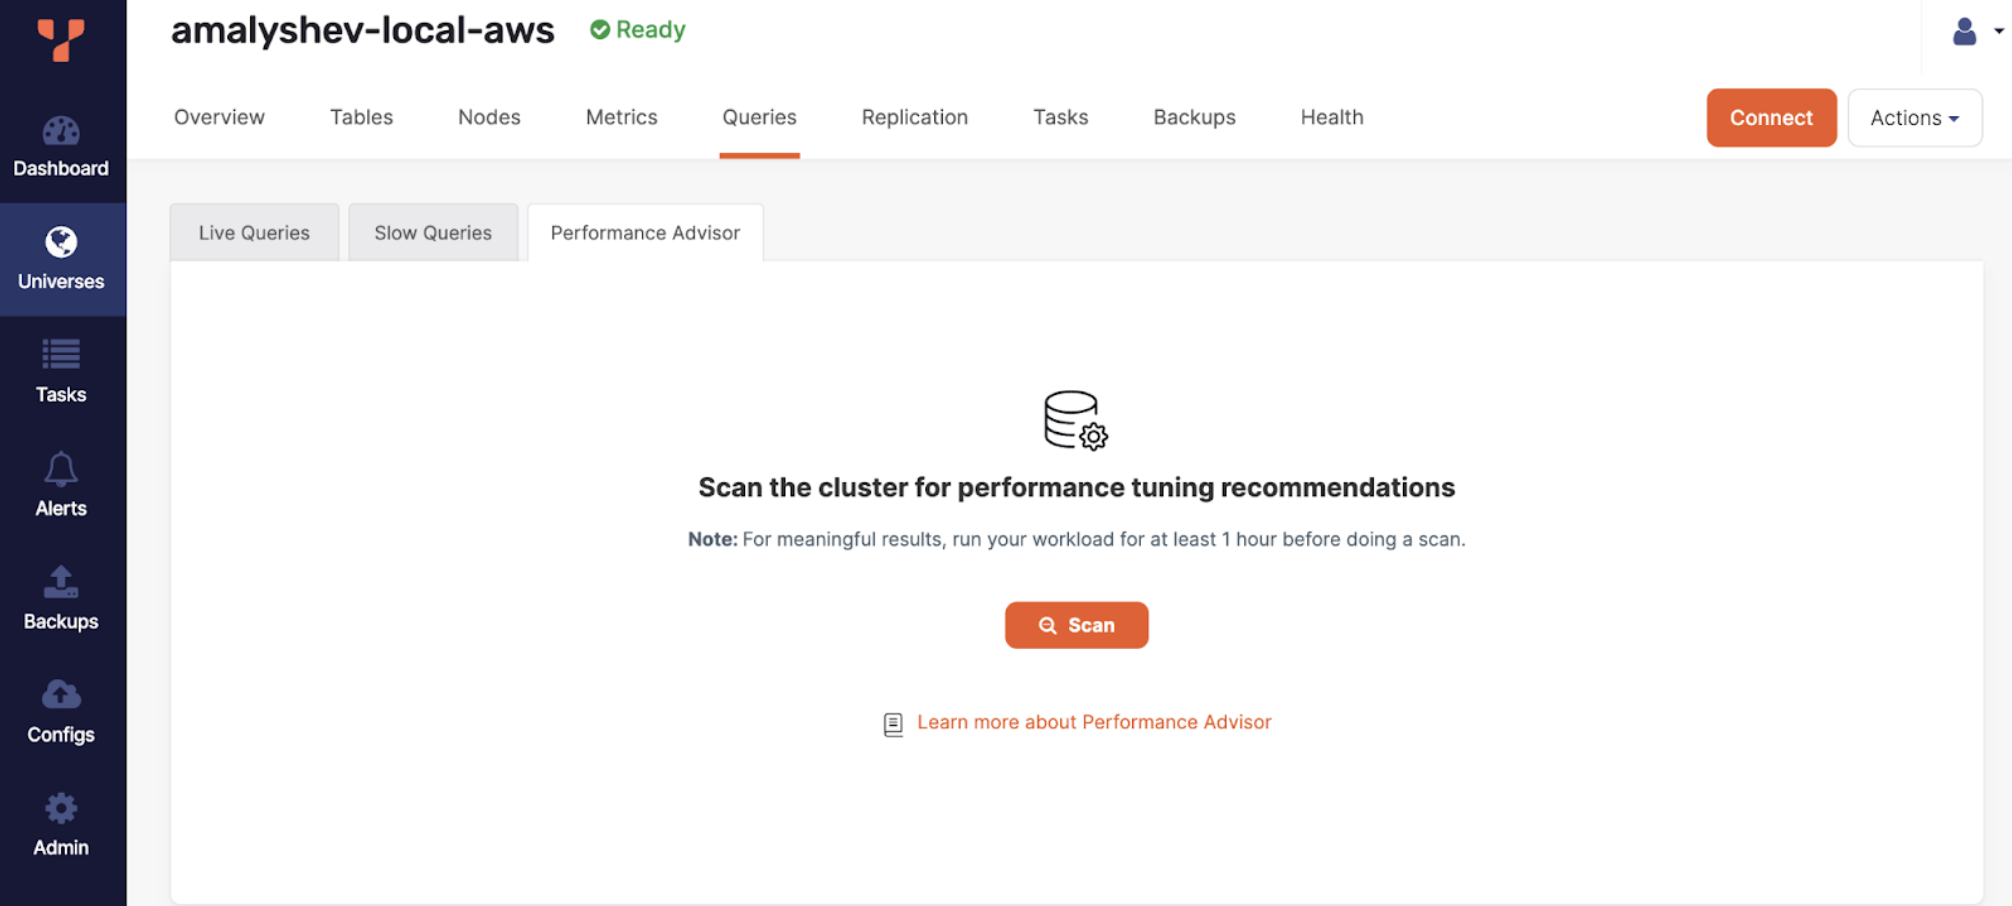
To scan a cluster for recommendations, navigate to Universes > Queries > Performance Advisor and click Scan as shown in the following illustration:

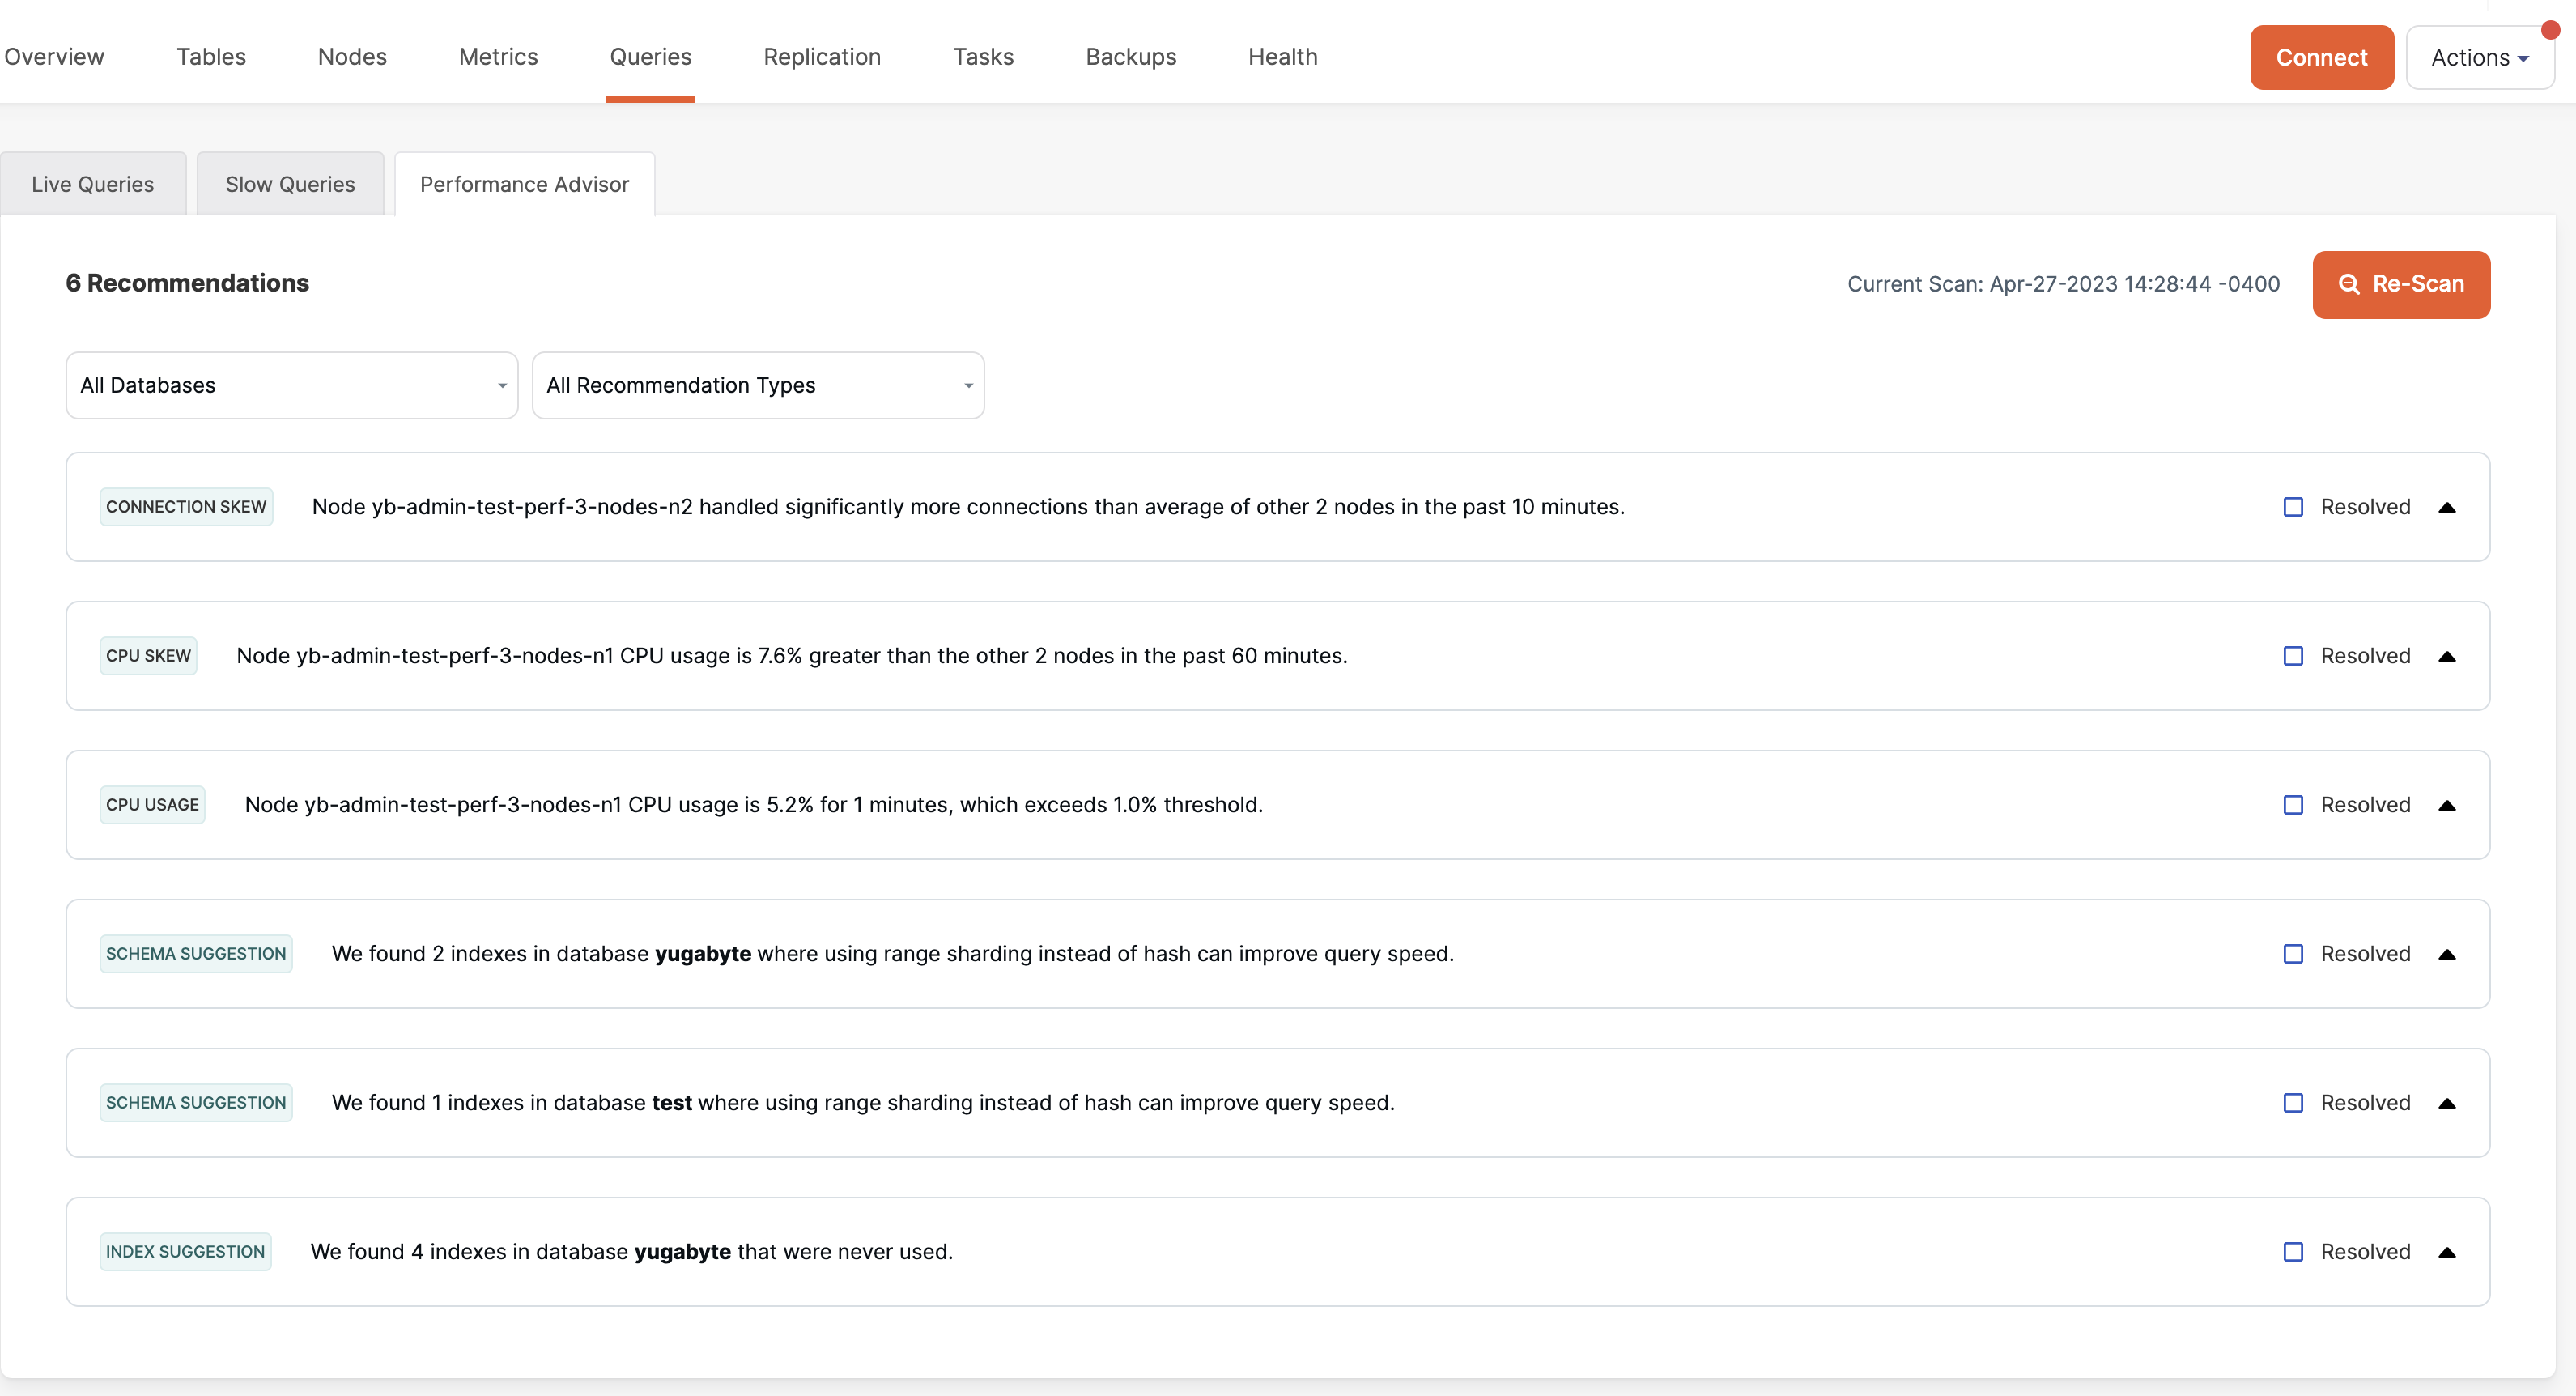
You should see a list of performance recommendations similar to the following illustration:

Index recommendations
Performance Advisor suggests dropping unused indexes to improve write performance and increase storage space. Performance Advisor uses the pg_stat_all_indexes view to determine unused indexes. Any index with an idx_scan of 0 is considered unused.
Indexes take up storage space on the same disk volume as the main table. They also increase the size of backups and can add to backup and restore time.
Indexes can slow down some operations. For example:
-
When doing an
INSERTorDELETEon a table, indexes need to be updated to remain consistent with the data in the main table. An index can also prevent a basic insert or delete operation from being executed as a single row transaction. -
When doing an
UPDATEon a table, if the modified column is part of the index, then the index must be updated as well.
Fix the problem
Connect to the database and use DROP INDEX to delete the unused indexes.
Schema recommendations
Advisor scans for indexes that can benefit from using range sharding instead of the default hash sharding.
Range sharding is more efficient for queries that look up a range of rows based on column values that are less than, greater than, or that lie between some user specified values. For example, with timestamp columns, most queries use the timestamp column to filter data from a range of timestamps.
The following example shows a query that filters the data using a specific time window. First, create an order_details table:
CREATE TABLE order_details (
   order_id smallint NOT NULL,
   product_id smallint NOT NULL,
   unit_price real NOT NULL,
   order_updated  timestamp NOT NULL,
   PRIMARY KEY (order_id)
);
Then create an index on order_updated using HASH sharding:
CREATE INDEX ON order_details (order_updated HASH);
The following query finds the number of orders in a specific time window:
SELECT count(*) FROM order_details
  WHERE order_updated > '2018-05-01T15:14:10.386257'
  AND order_updated < '2018-05-01T15:16:10.386257';
Fix the problem
Connect to the database and use DROP INDEX to delete the indexes, and then recreate the indexes using range sharding. For more information on sharding strategies, refer to Sharding data across nodes.
Connection skew
Advisor scans node connections to determine whether some nodes are loaded with more connections than others. Advisor flags any node handling 50% more connections than the other nodes in the past hour. Connection skew recommendation is not raised until a node handles at least 50 simultaneous connections.
Connections should be distributed equally across all the nodes in the cluster. Unequal distribution of connections can result in hot nodes, causing higher resource use on those nodes. Excessive workload on a specific node can potentially cause stability issues.
Fix the problem
- If a load balancer is used to distribute connections among nodes of a cluster, review the configuration of the load balancer.
- If you are load balancing in your application or client, review your implementation.
Query load skew
Advisor scans queries to determine whether some nodes are handling more queries than others. Advisor flags nodes that processed 50% more queries than the other nodes in the past hour, or since the advisor was last run. Query load skew recommendation is not raised until a node processes at least 1000 queries in the past hour.
Queries should be distributed equally across all nodes in the cluster. Query load skew can be due to queries not being equally distributed among connections; if particular connections are executing a greater number of queries, this can result in a hot node. Excessive workload on a specific node can potentially cause stability issues.
Fix the problem
If you see query load skew, contact Yugabyte Support.
CPU skew and CPU usage
Advisor monitors CPU use to determine whether any nodes become hot spots. Advisor flags nodes where CPU use on a node is 50% greater than the other nodes in the cluster in the past hour (skew), or CPU use for a node exceeds 80% for 10 minutes (usage). CPU skew recommendation is not raised until node has at least 50% average CPU usage in the last 10 minutes.
CPU skew and high usage can be caused by a number of issues:
- A node has a higher number of connections.
- A node is receiving a higher number of queries.
- Set of rows or specific rows are accessed frequently by queries executing across different nodes in the cluster.
Any of these conditions can result in a hot spot.
Fix the problem
Review the sharding strategies for your primary and secondary indexes. Consistent hash sharding is better for scalability and preventing hot spots, while range sharding is better for range-based queries.
Rejected connection recommendations
Advisor monitors rejected YSQL connections. Advisor flags nodes that rejected one or more connections in the last hour. By default each YB-TServer can handle up to 300 simultaneous connections. This number can be configured using the ysql-max-connections YB-TServer flag.
Rejected connections can be caused by:
- Connection skew - all clients are connected to one YB-TServer.
- Too many clients or too large connection pool sizes.
- Connection pooling not used on the client side and too many simultaneous requests.
- Load balancer configured incorrectly.
Fix the problem
Review your YSQL client's configuration to see if connection pooling is configured and pool sizes are correct. If you need more connections, review YB-TServer memory usage. If enough free memory is present, increase the number of ysql-max-connections. Otherwise increase the number of YB-TServers to spread connections across them.
Hot shard
Advisor monitors per-table read and write statistics on each node. Advisor flags nodes that processed 8x more reads or writes for a particular table in the last 10 minutes. Hot shard recommendations are not raised until a node processes at least 600 reads or writes during the last 10 minutes.
In YugabyteDB, a "hot shard" problem can occur when one or a few tablets (or shards) of a table receive a disproportionately high volume of read or write requests, compared to the other shards. This can lead to performance issues, as the hot shards become a bottleneck and are unable to handle the load efficiently.
A hot shard problem can cause uneven data distribution across the cluster, leading to slower query response times and increased resource utilization on the hot shards. In extreme cases, it can lead to node failures or cluster instability.
A hot shard can be caused by:
- Using range sharding with sub-optimal shard configuration.
- An application reading or writing one particular row too often.
Fix the problem If range sharding is used, analyze reads and writes and recreate the table with a more balanced shard distribution across nodes.
Limitations
- Currently, performance advisor is only partially supported for YCQL-only universes. To access all features, turn on the YSQL API. See Enable database endpoints and authorization.
- Currently, you can't schedule periodic performance advisor runs.
- Currently, you can only configure performance recommendation thresholds via the API.
- Performance recommendations can only be marked resolved via the UI; this state is not persisted.
- Limited set of performance recommendations.