Scaling transactions
Transactions are a set of SQL statements that are expected to be executed atomically. It is a sequence of one or more operations or database commands that are executed as a single unit of work. The fundamental goal of a transaction is to ensure the consistency, integrity, and reliability of the database - even during failures or concurrent access by multiple users. Transactions scale linearly in YugabyteDB as more nodes are added to the cluster.
Getting a transaction to work correctly on a distributed database involves multiple components, and the following sections describe how they work.
How transactions work
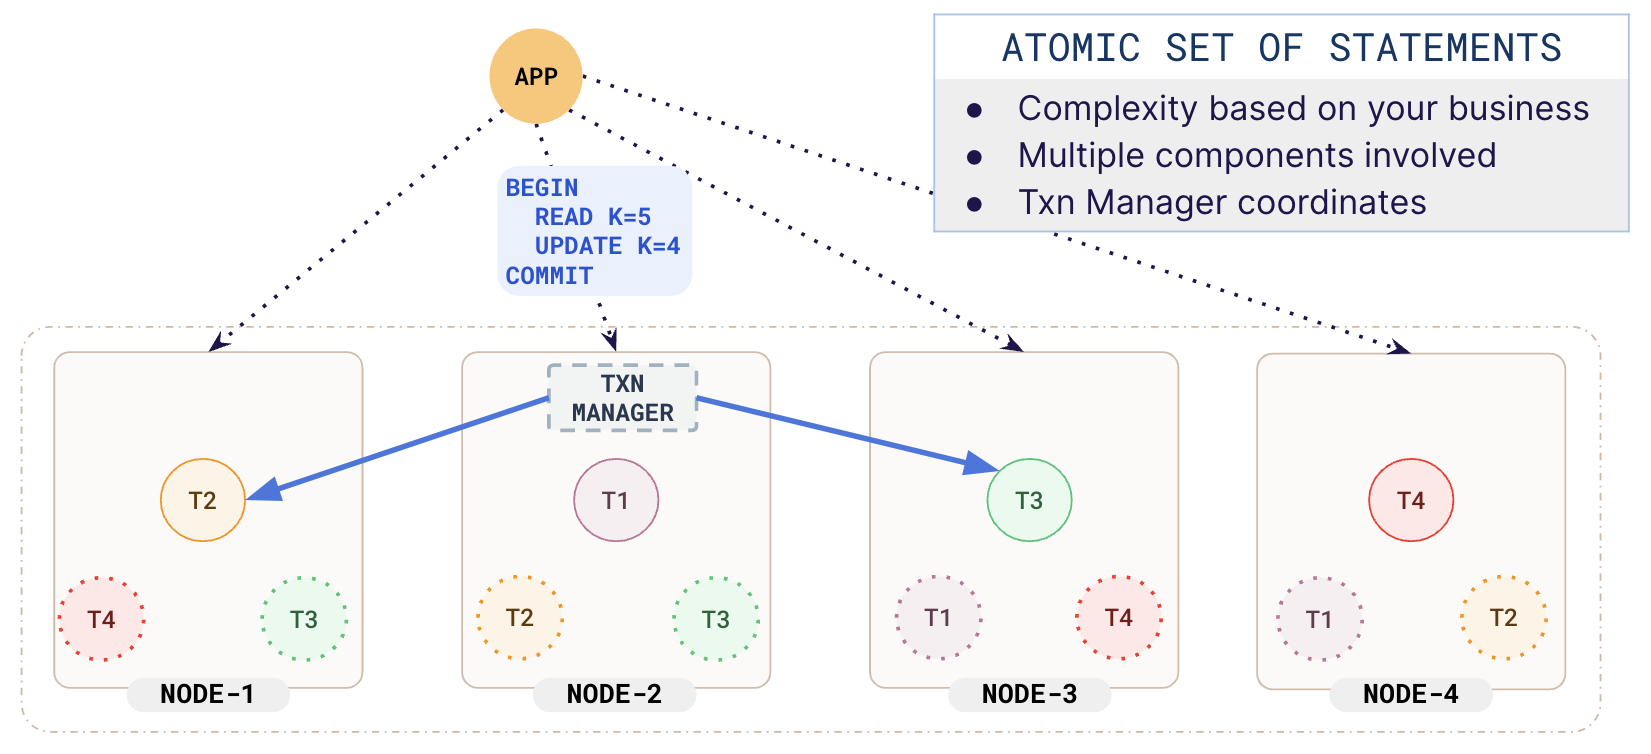
A node the client connects to acts as the transaction manager. This transaction manager acquires the necessary locks, talks to the leaders for the keys involved in the transaction, communicates with the transaction status tablet, and then the transaction is committed to the leader and replicated to the respective followers.
In the following illustration, you can see that as the connection is to NODE-2, the transaction manager is created on that node. This manager coordinates the transaction involving keys belonging to T2 and T3.

OLTP benchmark
The Transaction Processing System Benchmark(TPC-C) is the gold standard for measuring the transaction processing capacity of a database. It simulates order entry for a wholesale parts supplier. It includes a mixture of transaction types, including the following:
- Entering and delivering orders
- Recording payments
- Checking order status
- Monitoring stock levels
The performance metric measures the number of new orders that can be processed per minute and is expressed in transactions per minute (TPM-C). The benchmark is designed to simulate business expansion by increasing the number of warehouses.
TPC-C results
The following shows the results for the TPC-C benchmark using the following configuration:
- YugabyteDB version 2.18.0
- AWS, us-west region, c5d.9xlarge instances
- Replication factor 3
100K warehouse
The 100K benchmark was run on a universe with 59 nodes.
| Efficiency | TPMC | Average New Order Latency (ms) | YSQL Ops/sec | CPU Usage (%) |
|---|---|---|---|---|
| 99.83 | 1283804.18 | 51.86 | 348602.48 | 58.22 |
With only 59 nodes, YugabyteDB breezed through the 100K warehouse at a 99.83% efficiency and clocked 1.3 million transactions per minute.
150K warehouse
The 100K benchmark was run on a universe scaled out to 75 nodes.
| Efficiency | TPMC | Average New Order Latency (ms) | YSQL Ops/sec | CPU Usage (%) |
|---|---|---|---|---|
| 99.3 | 1M | 123.33 | 950K | 80 |
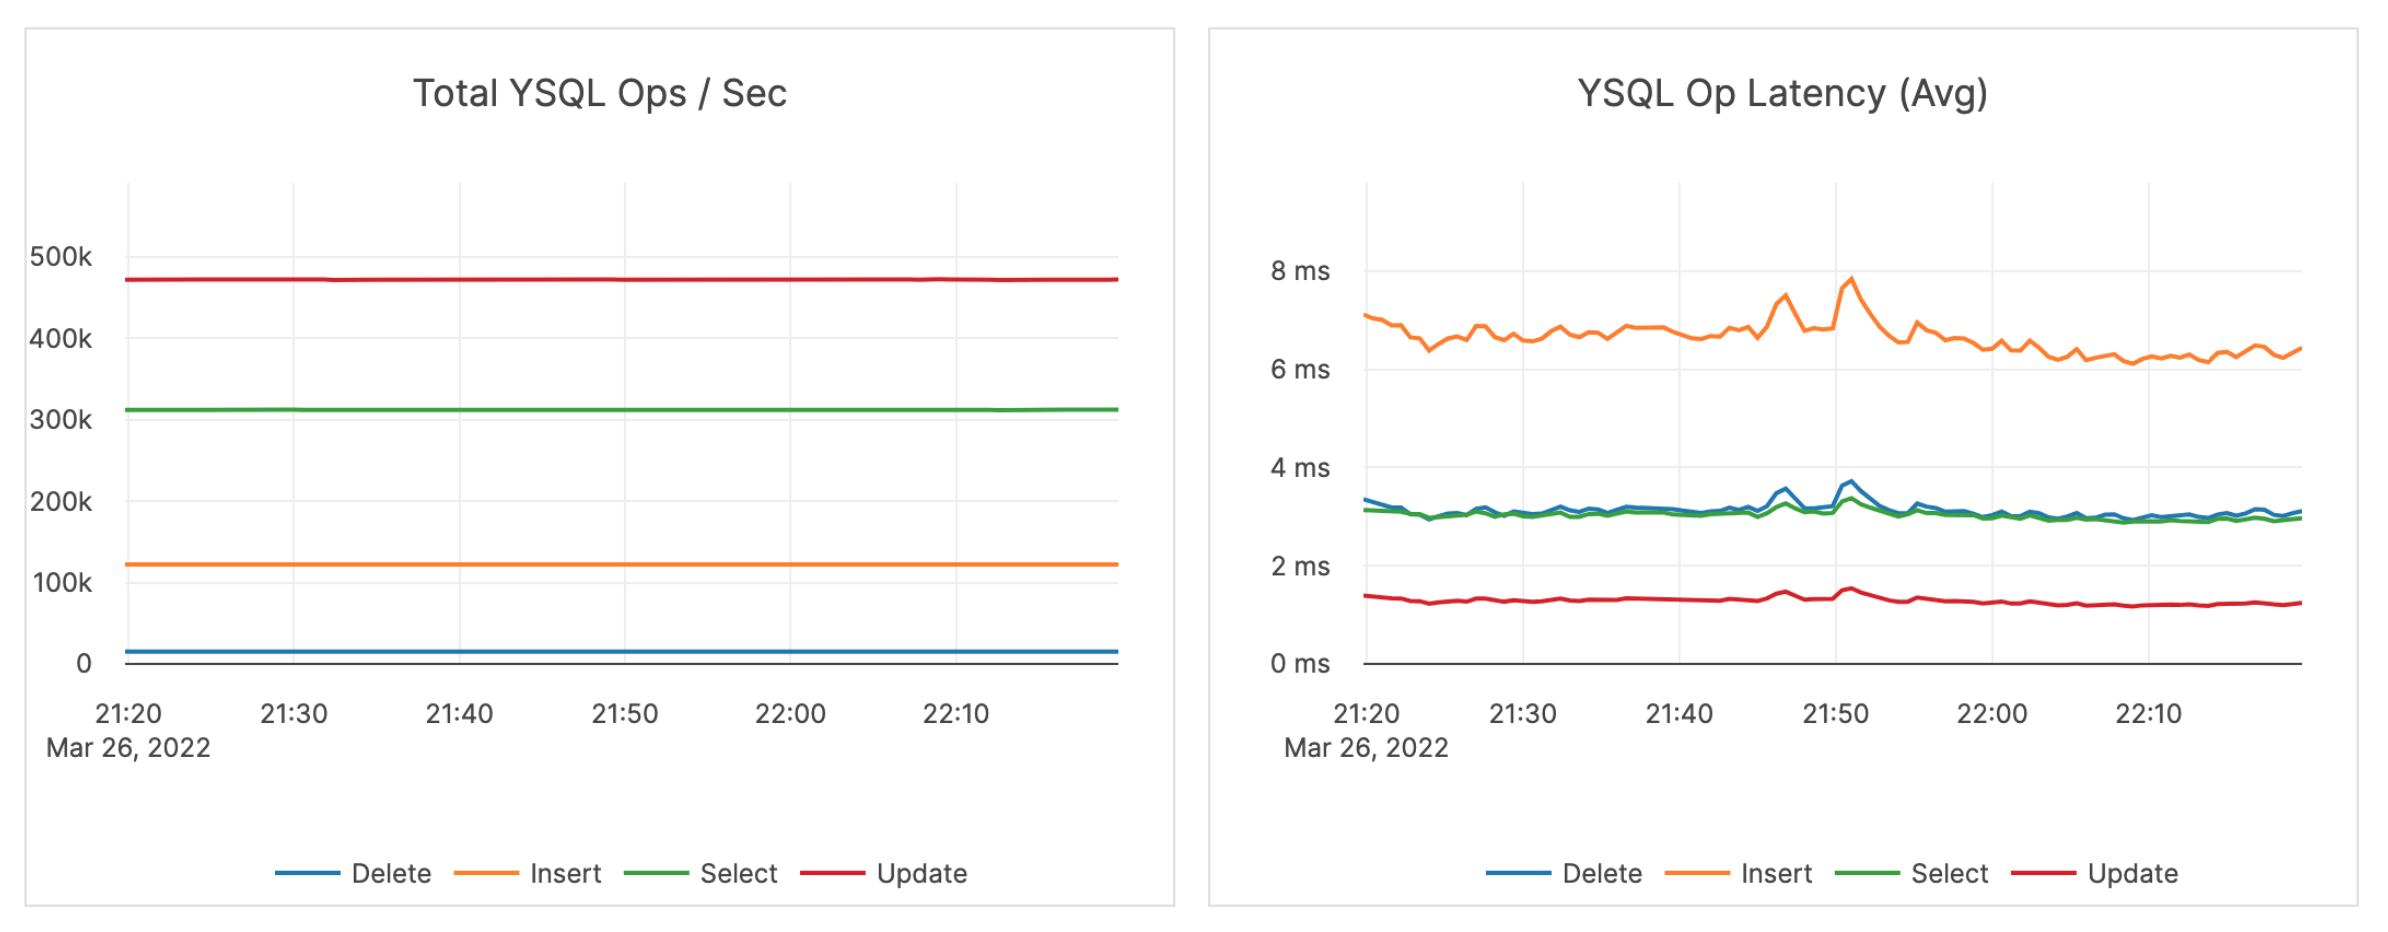
The latency and IOPS during the test execution are shown in the following illustration.
