Scale out a universe
YugabyteDB can scale seamlessly while running a read-write workload. You can see this by using the YB Workload Simulator application against a three-node universe with a replication factor of 3 and add a node while the workload is running. Using the built-in metrics, you can observe how the universe scales out by verifying that the number of read and write IOPS are evenly distributed across all nodes at all times.
Set up a universe
Follow the setup instructions to start a local multi-node universe, connect the YB Workload Simulator application, and run a read-write workload. To verify that the application is running correctly, navigate to the application UI at http://localhost:8080/ to view the universe network diagram, as well as Latency and Throughput charts for the running workload.
Observe IOPS per node
To view a table of per-node statistics for the universe, navigate to the tablet-servers page. The following illustration shows the total read and write IOPS per node:
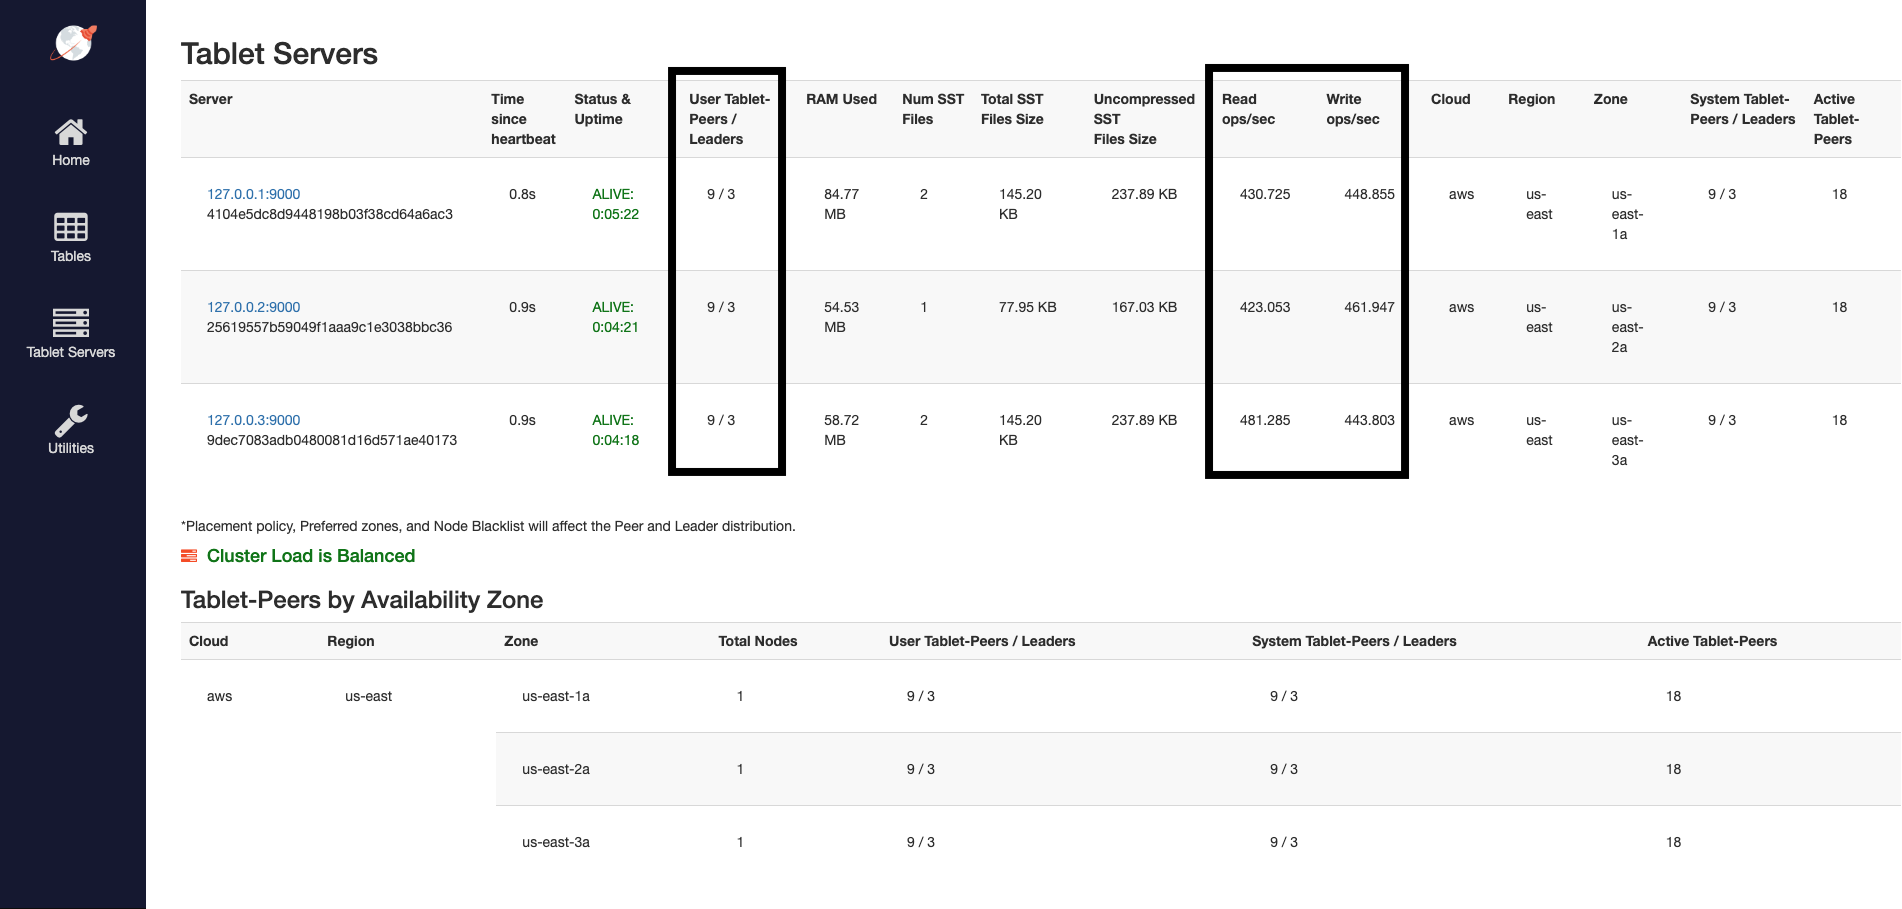
Notice that both reads and writes are approximately the same across all nodes, indicating uniform load across the nodes.
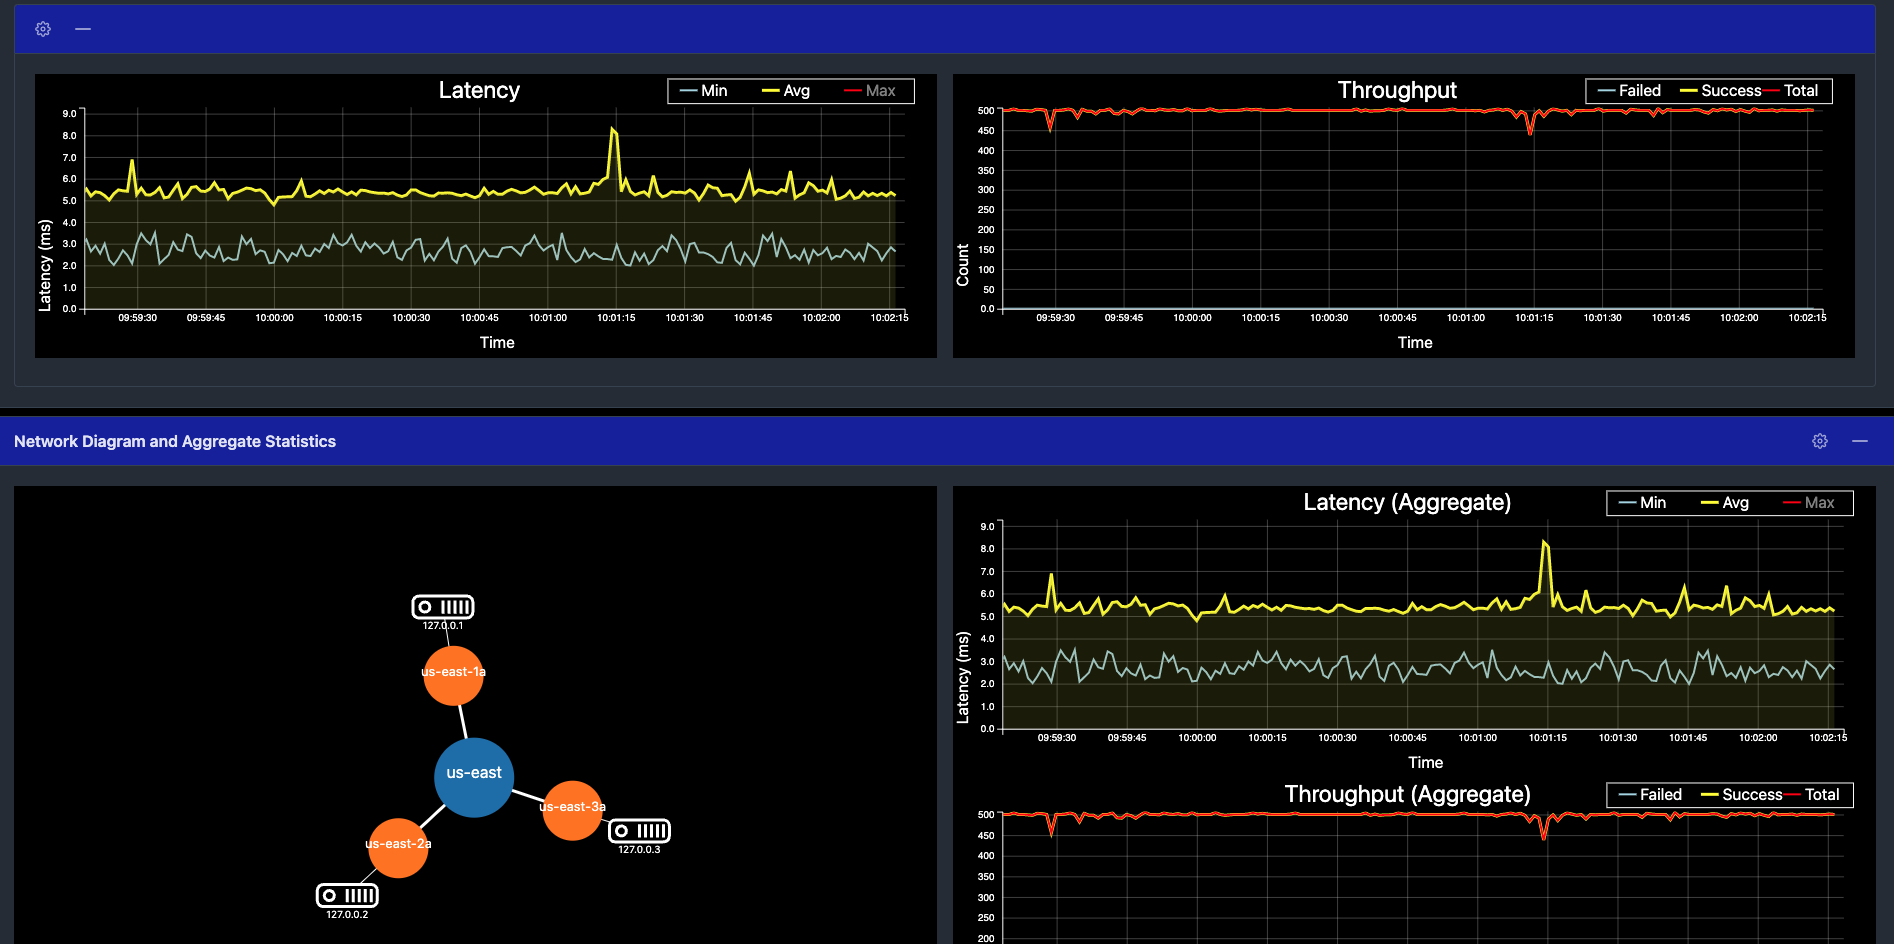
To view the latency and throughput on the universe while the workload is running, navigate to the simulation application UI.
Add a node
Add a node to the universe with the same flags, as follows:
Set up a local cluster
./bin/yugabyted start \
                --advertise_address=127.0.0.4 \
                --base_dir=${HOME}/var/node4 \
                --cloud_location=aws.us-east.us-east-1a \
                --join=127.0.0.1
Now you should have four nodes.
Observe linear scale-out
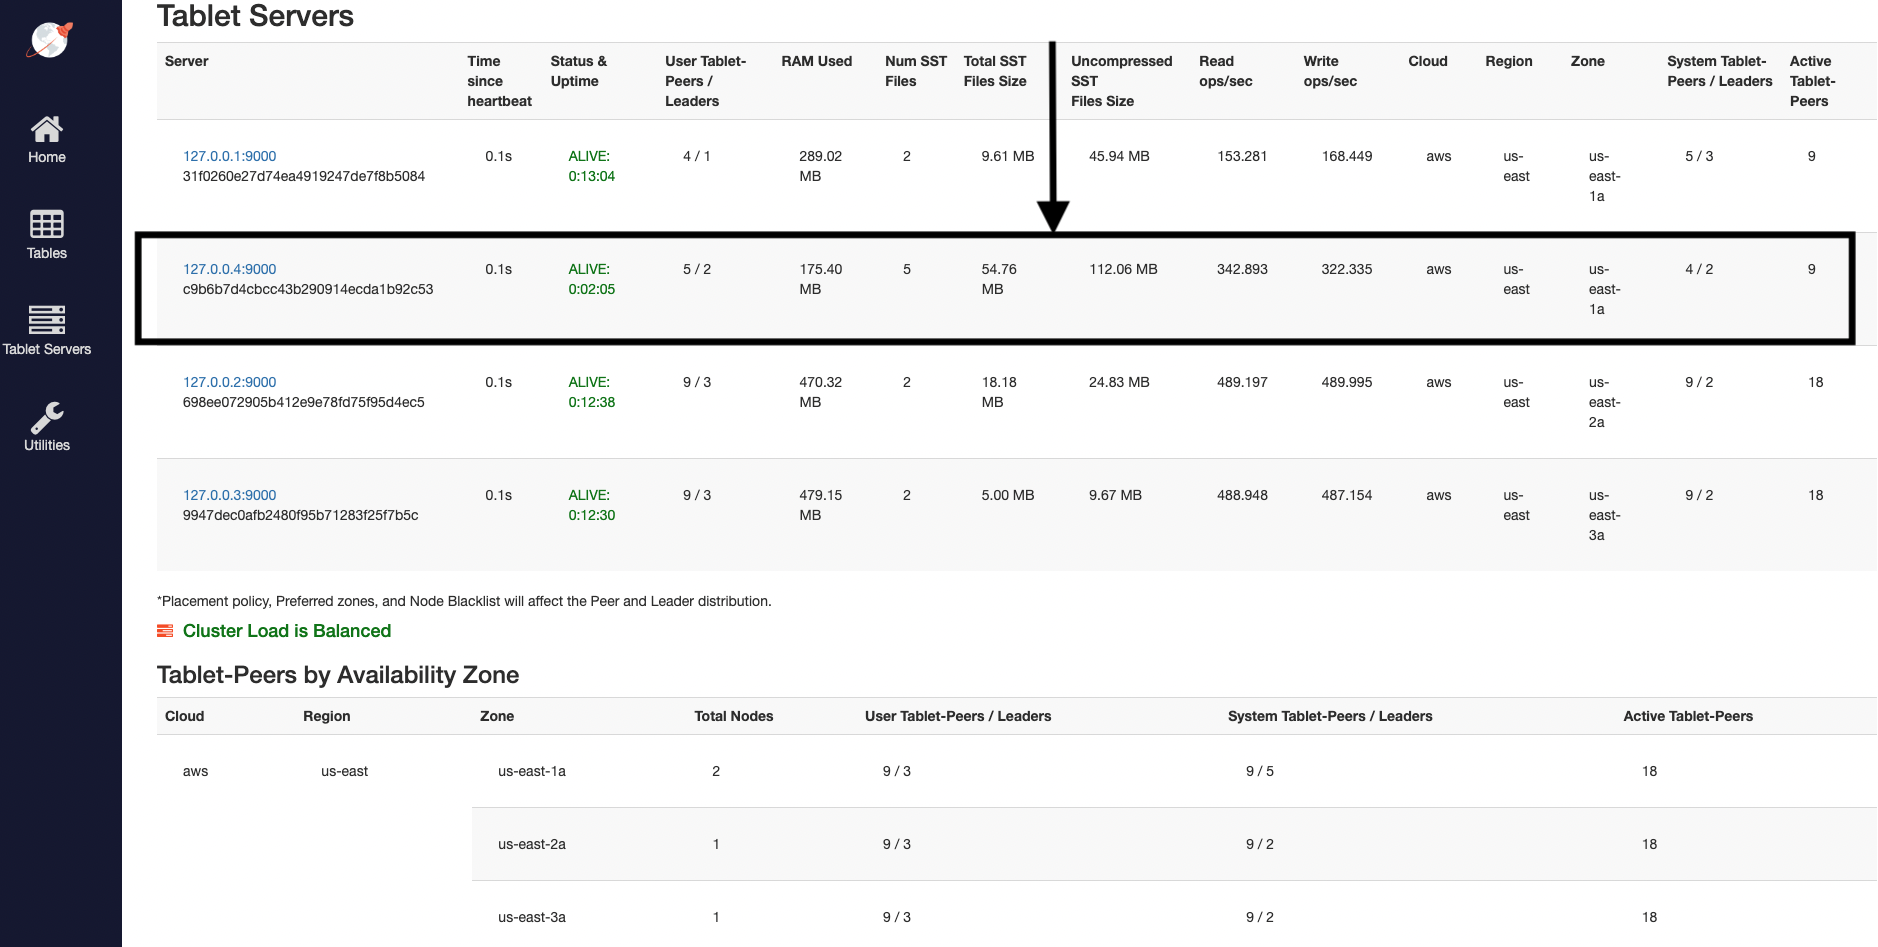
Refresh the tablet-servers page to see the statistics update. Shortly, you should see the new node performing a comparable number of reads and writes as the other nodes. The tablets are also distributed evenly across all four nodes.
The universe automatically lets the client know to use the newly added node for serving queries. This scaling out of client queries is completely transparent to the application logic, allowing the application to scale linearly for both reads and writes:
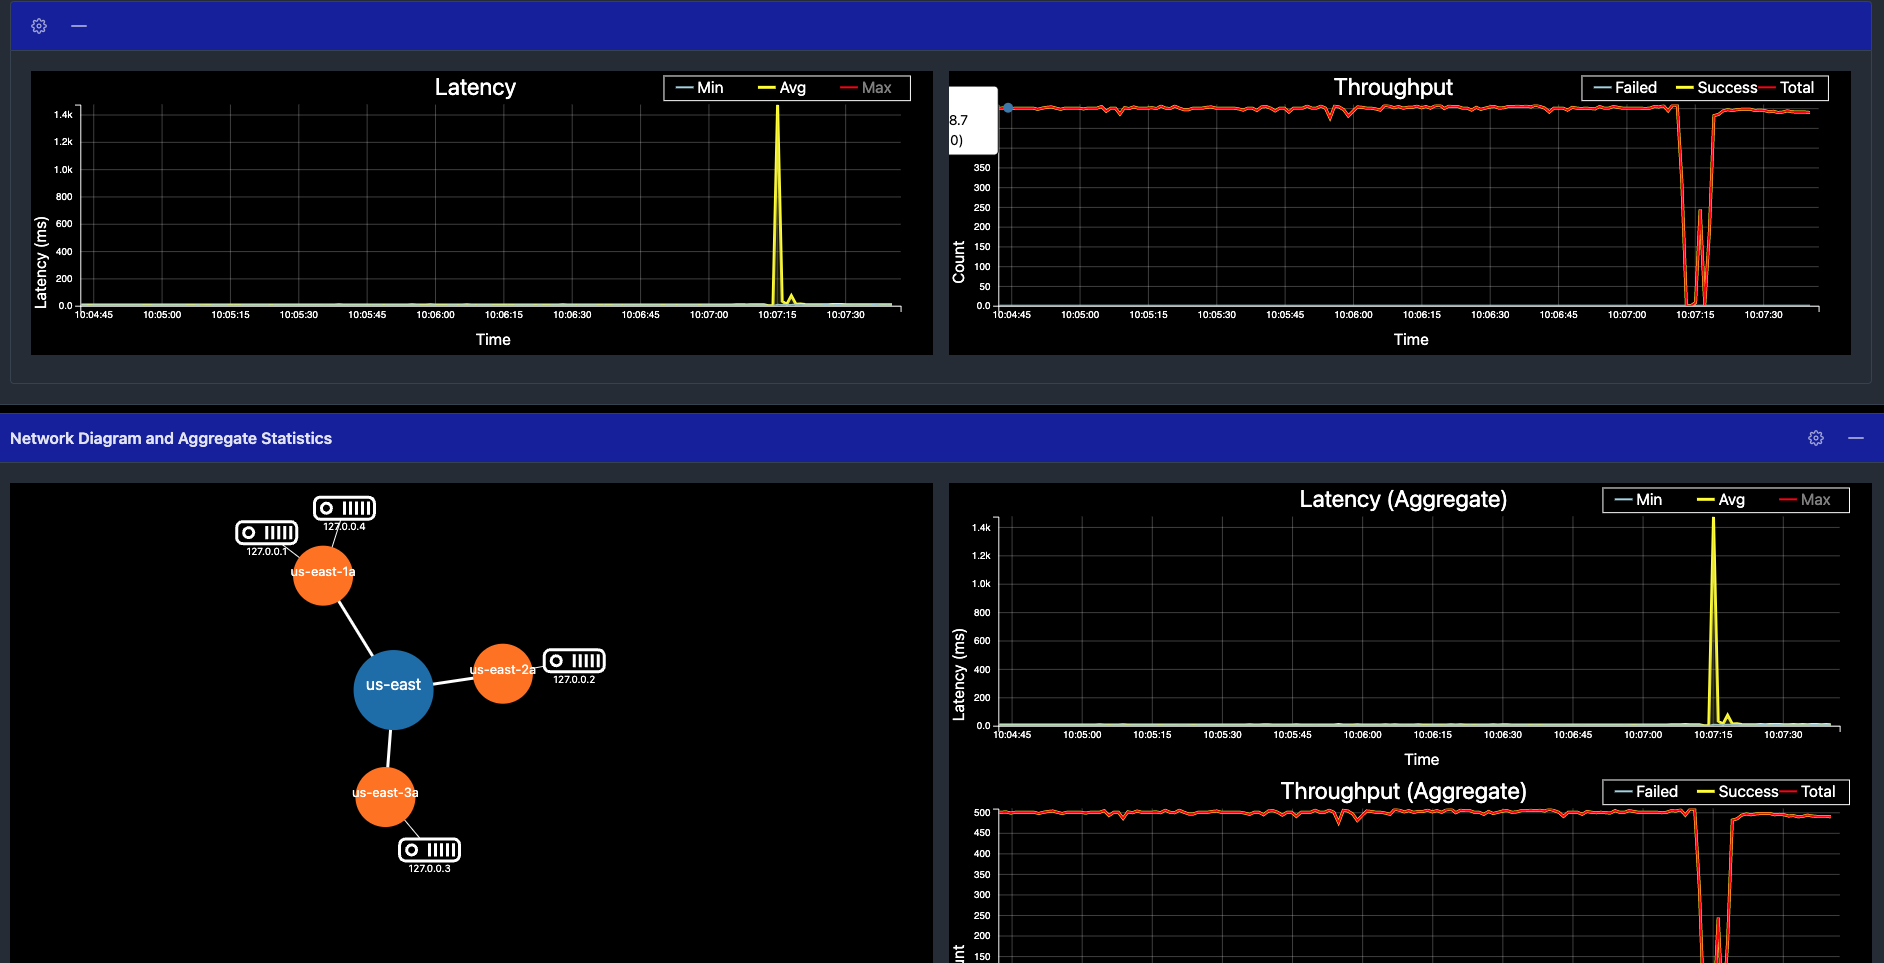
Navigate to the simulation application UI to see the new node being added to the network diagram. You can also notice a slight spike and drop in the latency and throughput when the node is added, and then both return to normal, as shown in the following illustration:
Remove a node
Remove the recently added node from the universe, as follows:
./bin/yugabyted stop --base_dir=${HOME}/var/node4
Observe linear scale-in
Refresh the tablet-servers page to see the statistics update. The Time since heartbeat value for that node will keep increasing. When that number reaches 60s (1 minute), YugabyteDB changes the status of that node from ALIVE to DEAD. Observe the load (tablets) and IOPS getting moved off the removed node and redistributed to the other nodes:
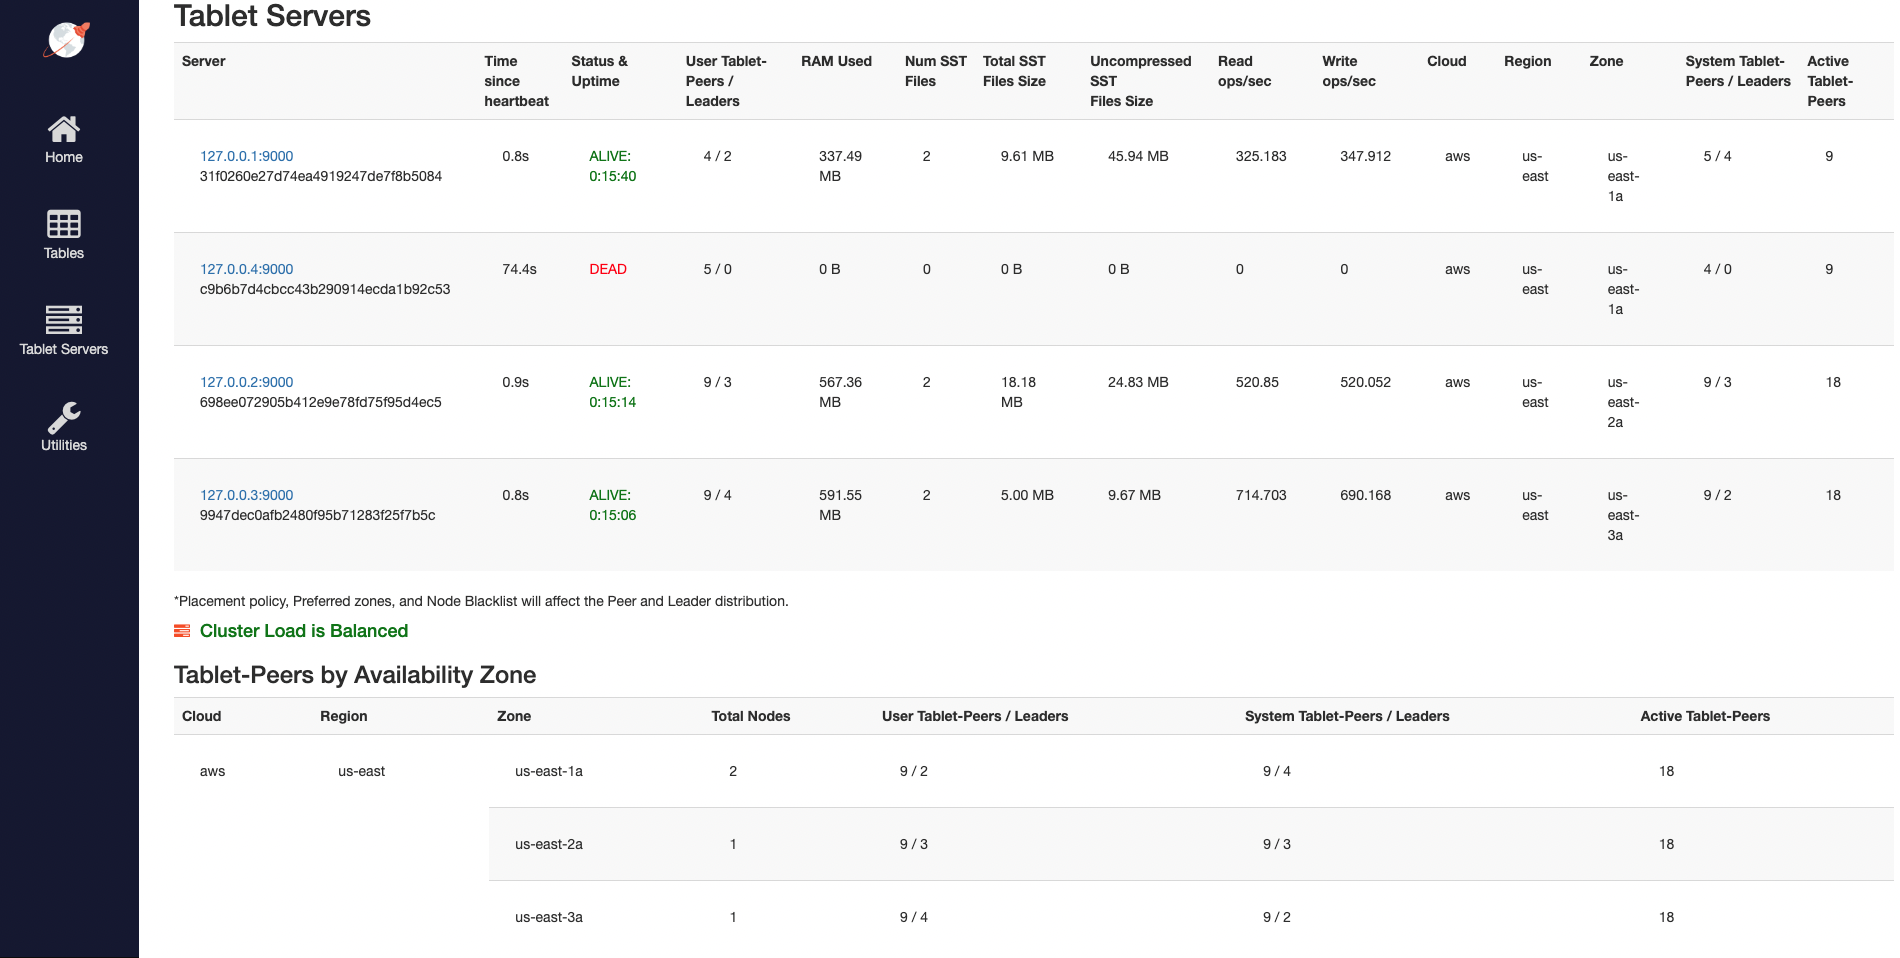
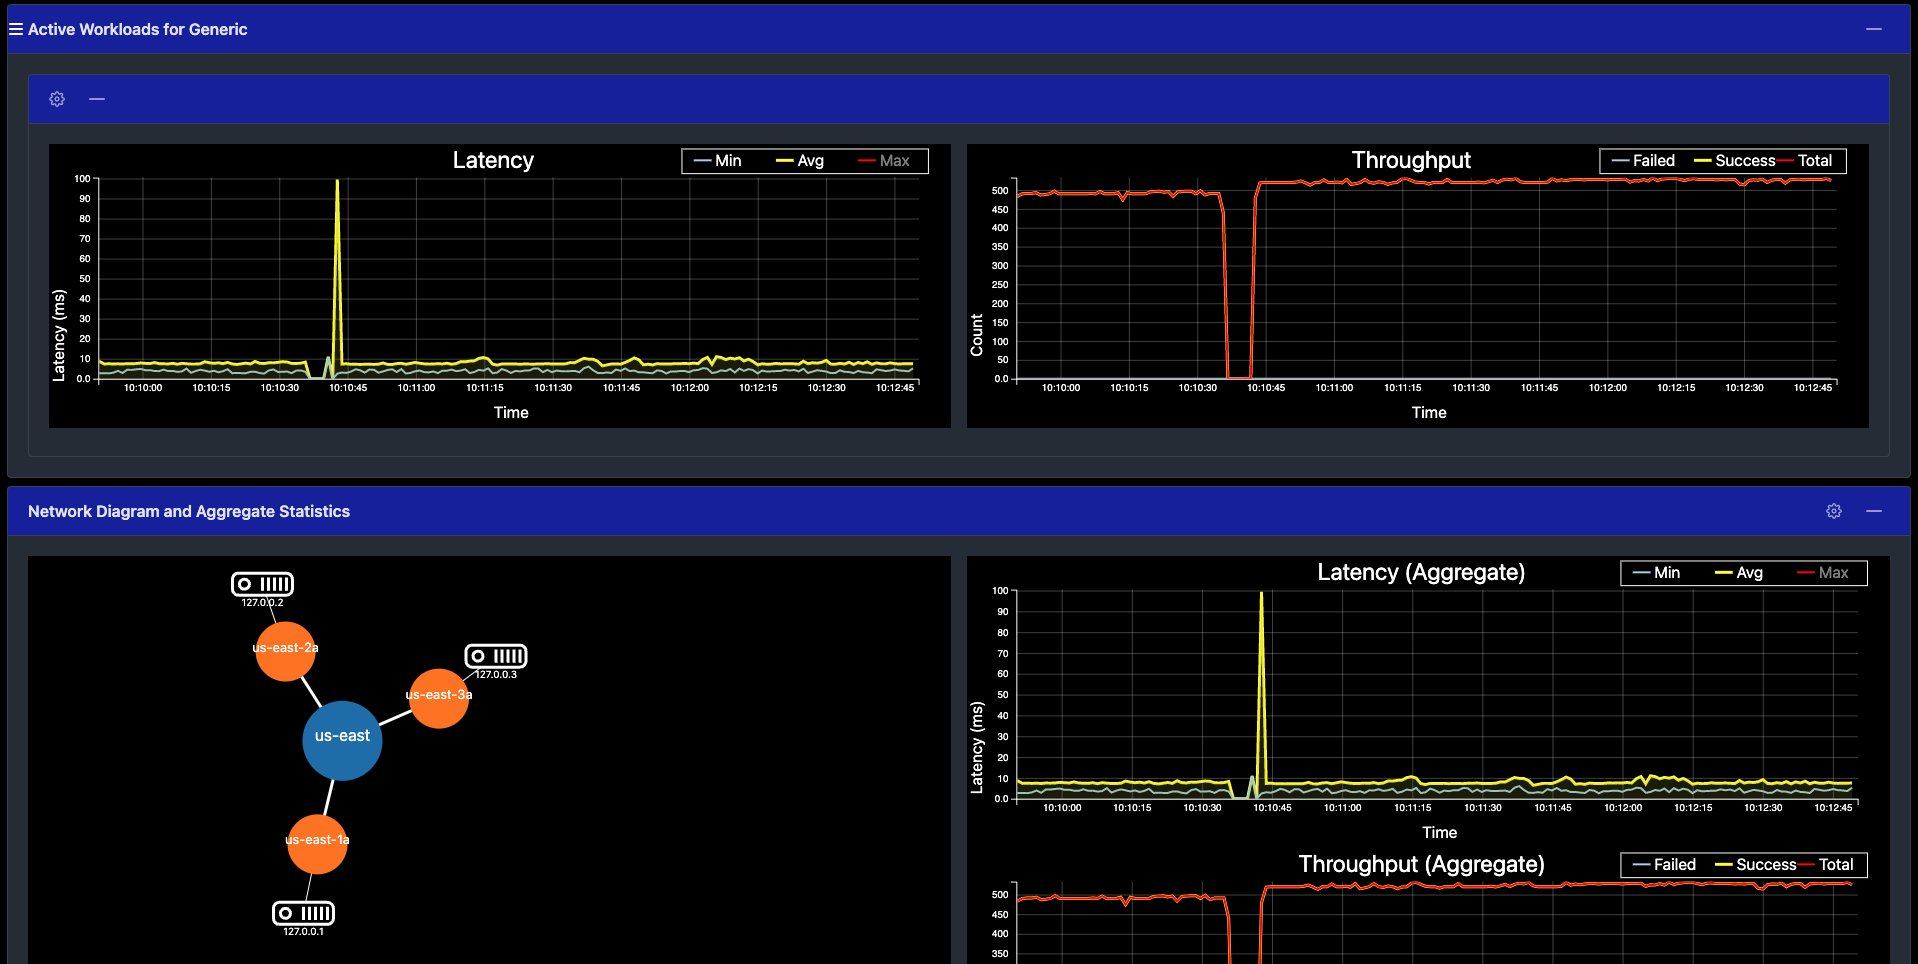
Navigate to the simulation application UI to see the node being removed from the network diagram when it is stopped. Note that it may take approximately 60s (1 minute) to display the updated network diagram. You can also notice a slight spike and drop in the latency and throughput, both of which resume immediately:
Clean up
You can shut down the local cluster by following the instructions provided in Destroy a local universe.