Expect an output similar to the following:
+----------------------------------------------------------------------------------------------------------+
|                                                yugabyted                                                 |
+----------------------------------------------------------------------------------------------------------+
| Status              : Running.                                                                           |
| Replication Factor  : 1                                                                                  |
| YugabyteDB UI       : http://127.0.0.1:15433                                                             |
| JDBC                : jdbc:postgresql://127.0.0.1:5433/yugabyte?user=yugabyte&password=yugabyte          |
| YSQL                : bin/ysqlsh   -U yugabyte -d yugabyte                                               |
| YCQL                : bin/ycqlsh   -u cassandra                                                          |
| Data Dir            : /Users/myuser/var/data                                                             |
| Log Dir             : /Users/myuser/var/logs                                                             |
| Universe UUID       : 41e54e9f-6f2f-4a46-befe-e0cd65d3056a                                               |
+----------------------------------------------------------------------------------------------------------+
After the cluster has been created, clients can connect to the YSQL and YCQL APIs at http://localhost:5433 and http://localhost:9042 respectively. You can also check ~/var/data to see the data directory and ~/var/logs to see the logs directory.
Execute the following command to check the cluster status at any time:
./bin/yugabyted status
Connect to the database
Using the YugabyteDB SQL shell, ysqlsh, you can connect to your cluster and interact with it using distributed SQL. ysqlsh is installed with YugabyteDB and is located in the bin directory of the YugabyteDB home directory.
(If you have previously installed YugabyteDB version 2.8 or later and created a cluster on the same computer, you may need to upgrade the YSQL system catalog to run the latest features.)
To open the YSQL shell, run ysqlsh:
./bin/ysqlsh
ysqlsh (11.2-YB-2.23.0.0-b0)
Type "help" for help.

yugabyte=#
To load sample data and explore an example using ysqlsh, follow the instructions in Install the Retail Analytics sample database.
Monitor your cluster
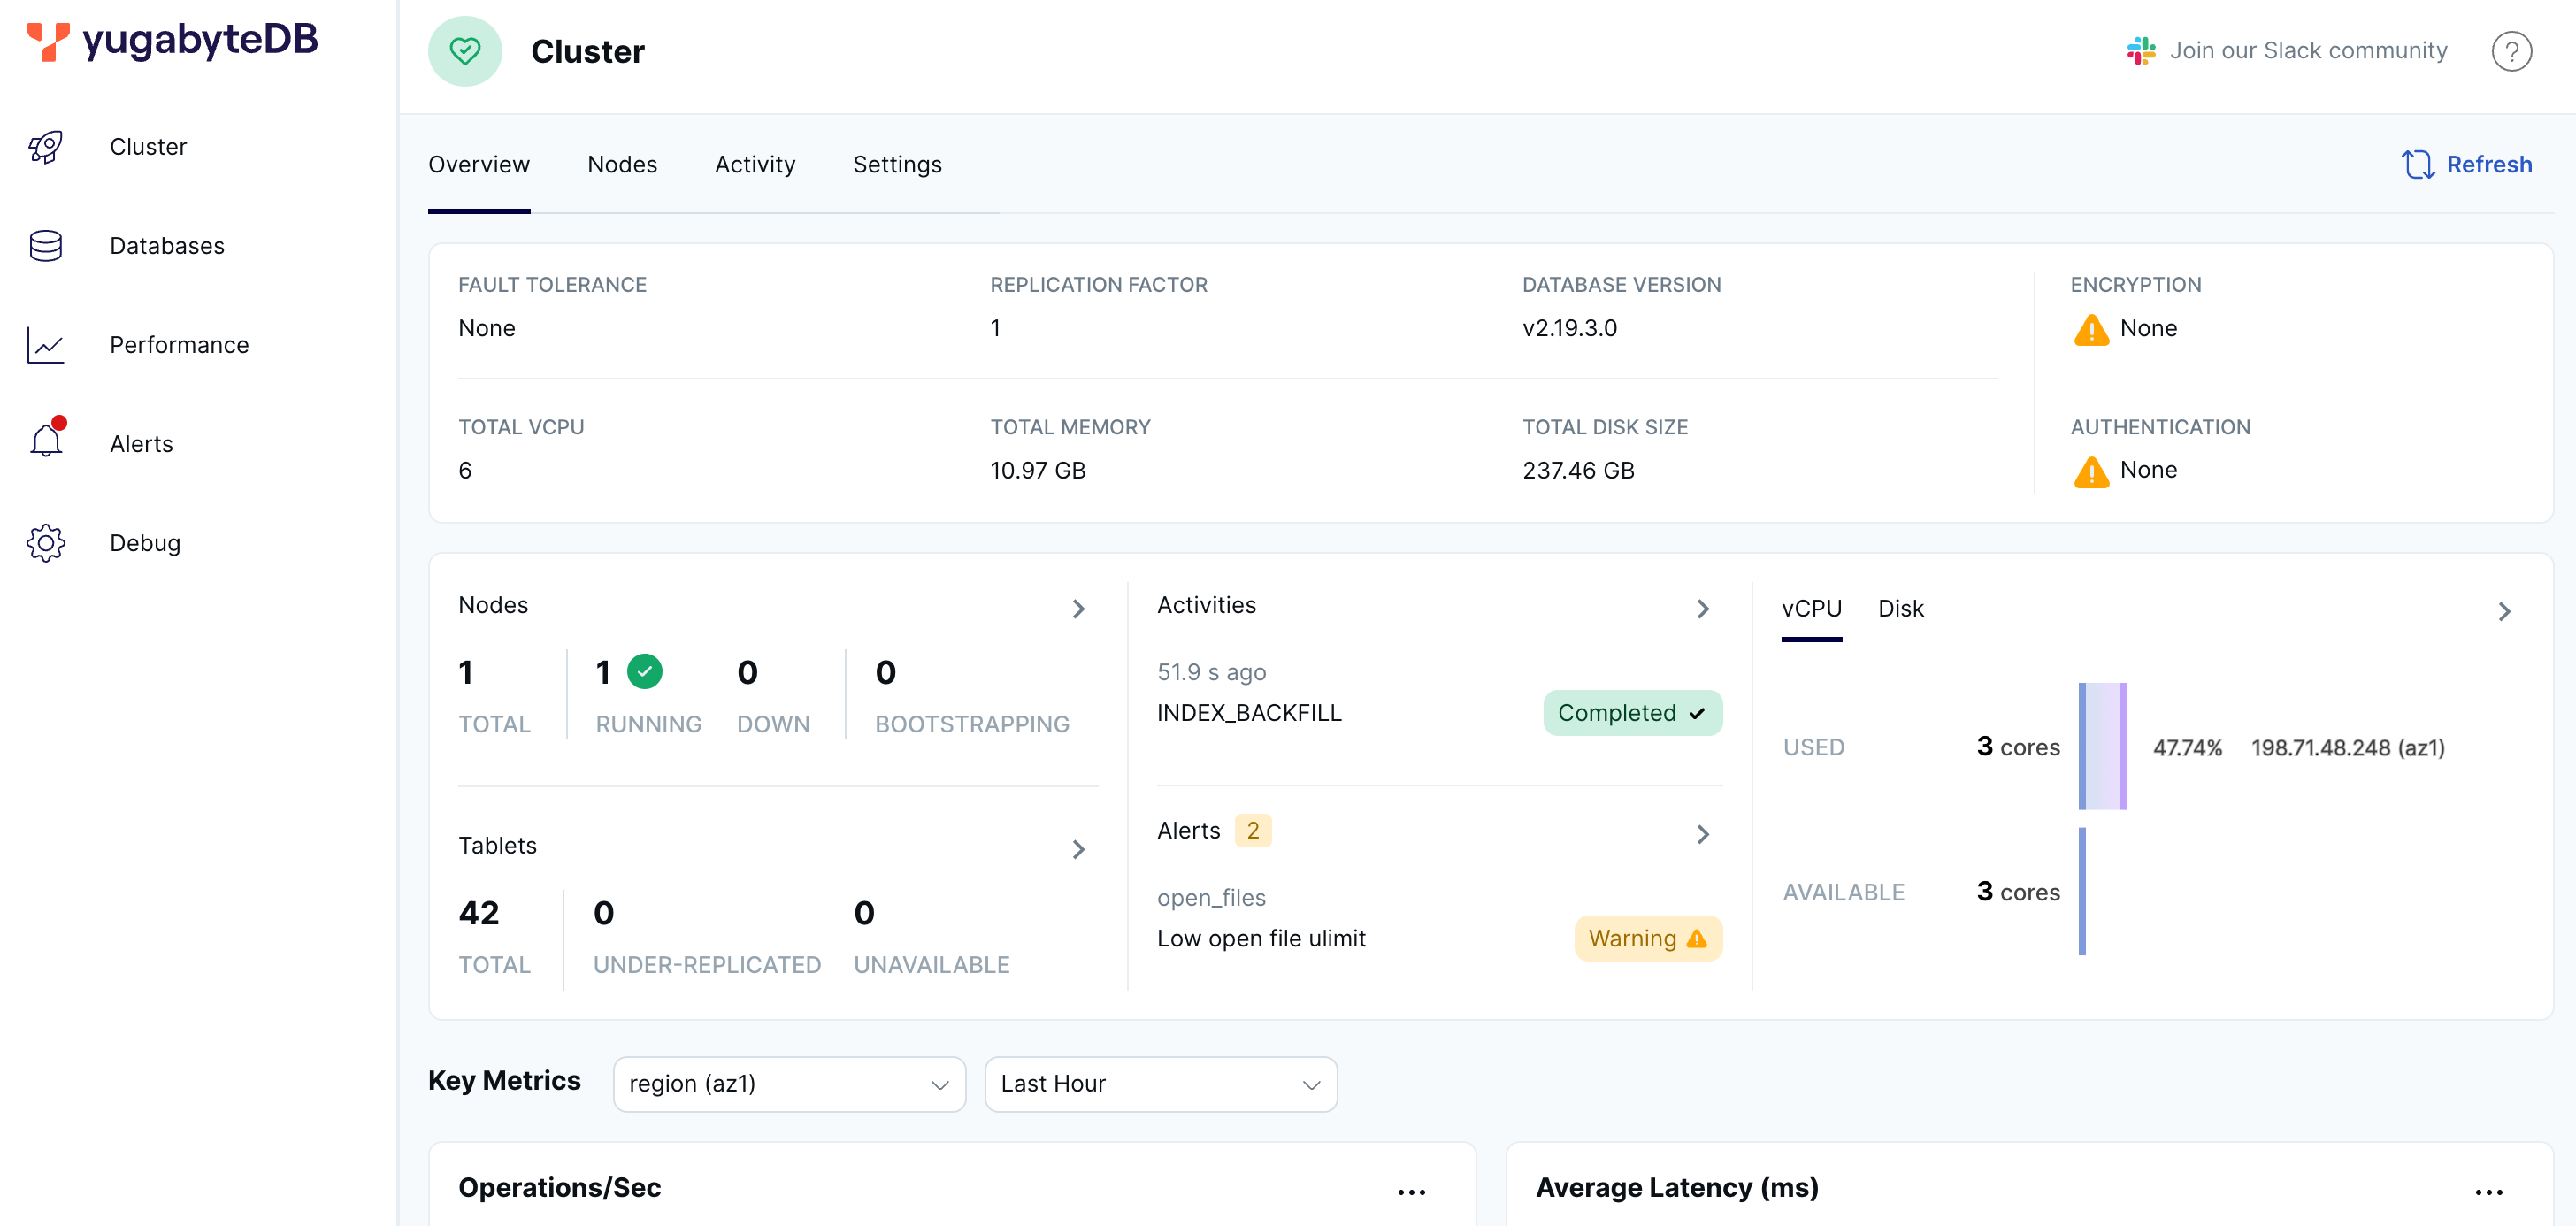
When you start a cluster using yugabyted, you can monitor the cluster using the YugabyteDB UI, available at http://127.0.0.1:15433.

The YugabyteDB UI provides cluster status, node information, performance metrics, and more.